Is there such a thing as easy accounting? Well, clearly, companies need expertise and professional support for many tasks but there are some you perform in-house at no extra cost and with just a little bit of knowhow. Astin Accounts Solutions Managing Director looks at some easy-to-use analytical tools in Excel
There are a number of different analytical tools available to accountants and finance professionals to assist with extracting and analysing data however, we would like to focus in this article on tools which are easily accessible via Excel so are effectively available with no additional costs to the company. In this easy accounting guide will be looking at how we can apply Excel to the following:
An easy way to explain correlation analysis is where you may have wondered if there is a relationship between the daily temperature outside and when people get their hair cut? Finding the relationship between these data sets is known as correlation analysis.
This technique allows you to determine whether there is a relationship between two separate variables and if so how strong that relationship may be. It is often most useful to test an assumption when you initially suspect there is a relationship between two variables.
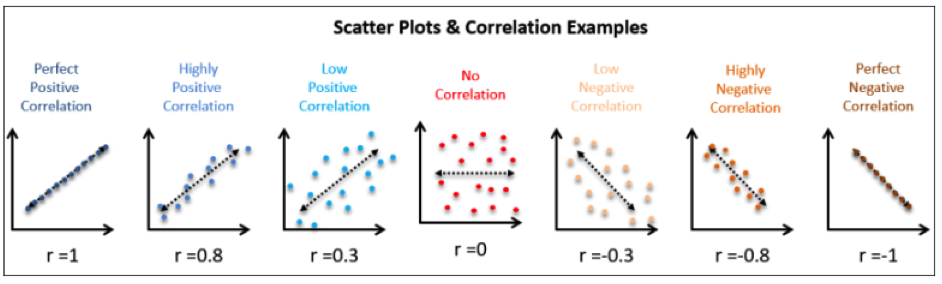
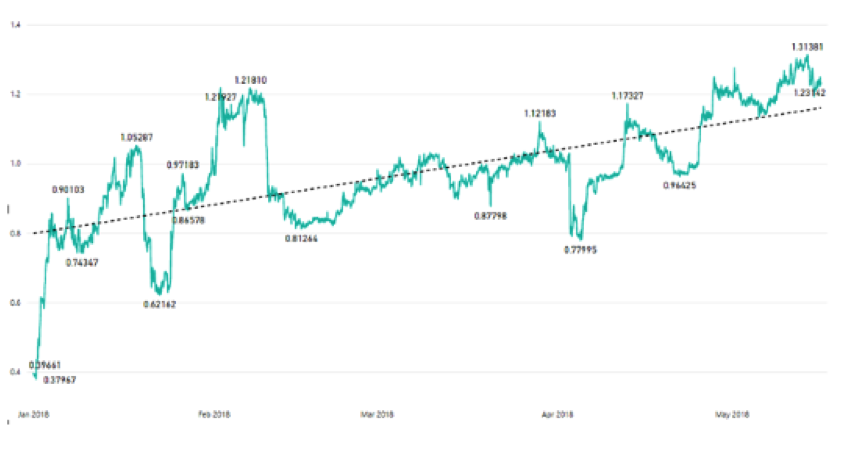
Correlation can be determined using scatter plot charts in Excel as below, where one variable is charted against the second. As you can see from the below a positive correlation will display a line increasing as you move from left to right and a negative correlation will be shown as a line decreasing from left to right across the chart.
 In addition to the use of scatter plot charts to establish the correlation, it is also possible to calculate the strength of the relationship, known as the correlation coefficient using a formula within Excel for calculating the correlation coefficient.
The coefficient ranges from -1 and +1 and this quantifies the direction and strength of the linear association between the two variables. The correlation can be positive e.g. higher levels of one variable are associated with higher levels of the other or negative e.g. higher levels of one variable are associated with lower levels of the other.
For clarification, a correlation of r = 0.8 suggests a highly, positive association whereby a correlation of r = -0.3 suggests a low negative correlation.
We have already seen above that it is possible to use Excel to plot two variables to determine whether there is a correlation between them, and we can also calculate the correlation strength using the correlation coefficient however, by introducing regression analysis we can also determine how much one variable will change by the increase or decrease in the other variable.
Regression analysis is a statistical tool for investigating the relationship between variables and again is another analytical tool available in Excel as part of the data analysis add-on pack.
Using an example, we could use correlation analysis to determine whether there is an increase in sales of ice cream when the temperature increases. Regression analysis would then be used to calculate how much extra ice cream would be sold for each 1 degree rise in temperature. This can be a very useful tool for forecasting in accounting.
Scenario analysis is an analytical process that would allow you to analyse a variety of possible future events or scenarios by considering alternative possible outcomes. This analysis could be used when you are not sure what decision to make or which course of action is best to pursue.
Again Excel is able to assist in this area as it offers a scenario manager.
If we consider the following forecast information within an Excel workbook, we can then assess different scenarios using Excel’s scenario manager:
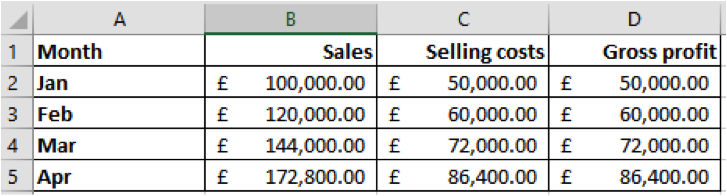
So let’s now consider what would happen if the sales were to increase by 10% and the selling costs were to remain the same?
Or what if the sales and costs were both to increase by 10%?
Step 1: Select the cells that will change based on the different scenarios. For this example, both the sales and selling costs will be subject to change.
Step 2: Under Data Tools and What IF Analysis, select Scenario Manager.
Step 3: Select Add. Give your scenario a name. The first scenario will be Original Data. Ensure that the cells that Changing Cells are correct (that we selected in step 1). You can also add in some comments so any other users can understand the objective for the analysis. Then select OK.
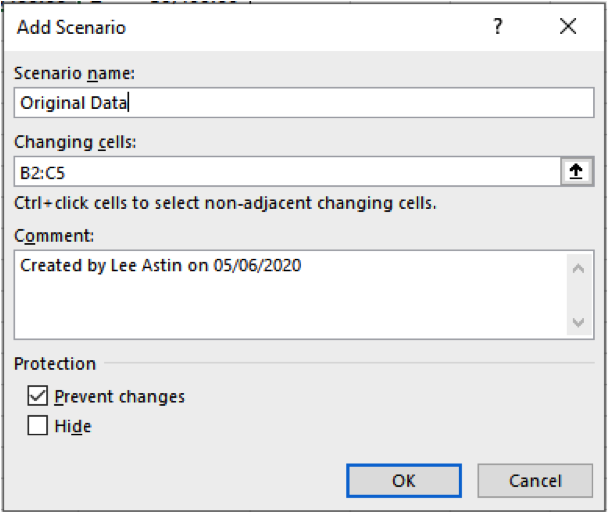
Step 4: The scenario values must now be set. As this is the original data, we will not change any values.
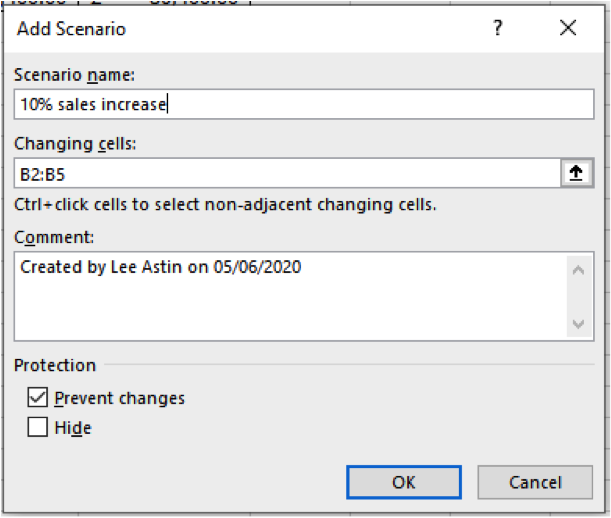
To set up the next scenario, where sales increase by 10% and selling costs remain the same, repeat steps 3 and 4 above, but this time give the scenario a different name. The scenario values must be changed this time.
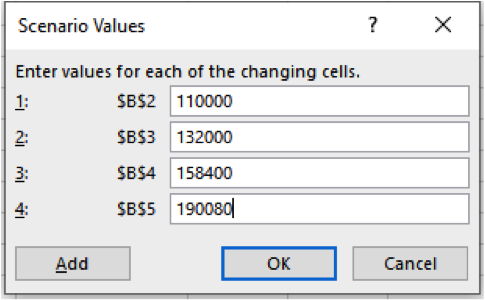
The sales values are in cells B2:B5 and these are the cells we must change in the scenario values dialogue box. Increase each of these values by 10%.
To set up the final scenario whereby sales and costs are both to increase by 10%, repeat steps 3 and 4 again. This time we will need to change the values so both the sales and cost of sales increase by 10% on the original value.
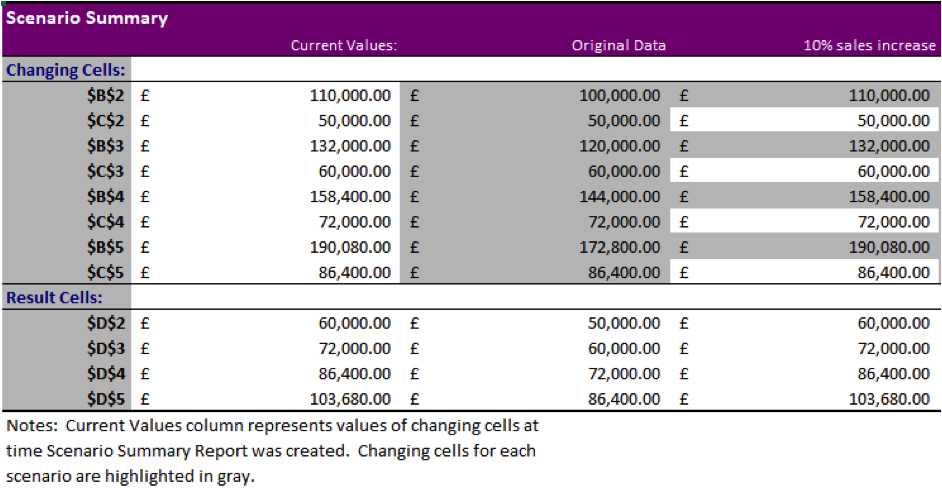
We can now in the Scenario Manager dialogue box select any of the scenarios and the workbook will update automatically. We can also select a summary to produce a report showing each of the different scenarios.
Time series data is data that is collected at spaced intervals. Accountants and finance departments are often collecting data day by day, such as sales invoices.
Time series analysis explores this data to extract meaningful statistics or data characteristics. If we use the example of collecting sales data daily, this data can be analysed over varying time periods such as weeks, months, quarters and years. It can be analysed against other data too over the same time spans all being dependent upon the requirements of the organisation.
This analysis is often used when you want to assess changes over a period of time or predict future events based upon historical data.
Once again, we can use Excel for time series analysis, as data can be easily stored over time periods and visualised easily. Later versions of Excel, pivot tables include a timeline feature which then allows you to dissect the data over time periods.
Excel also includes a forecasting function that allows you to make time-based predictions of future values, based on historical data.
Linear programming is a method of identifying the best outcome based on a set of constraints, using a linear mathematical model. This allows you to solve problems that involve minimsing and maximising conditions, such as how can we maximise profit whilst minimising costs? It is useful if you have a number of constraints such as time, raw materials, etc. and you want to establish the best way to make these work together, or where to direct your resources for maximum profit.
Once again Excel is able to assist as it has a tool that allows you to perform this sort of analysis, without the need to program. The Excel tool is called Solver, and it is available as an add-in that you must turn on.
Here we will look at a simple example of how Solver can be used:
Based on the data shown below, the sales value is calculated by multiplying the units sold by the price per unit. The total cost is calculated by multiplying the cost per unit by the units sold. The revenue is calculated by deducting the cost from sales. This way, the revenue formula is all dependent on the sales and costs formula.
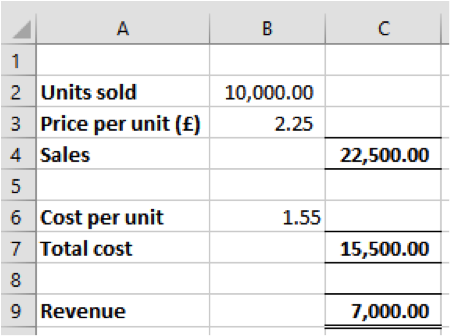
We have been set a target revenue of £15,000 and we have some constraints.
The first constraint is that the price per unit must be between £2.00 to £2.50. The second constraint is that the units sold can only be full units. The cost per unit is fixed at £1.55. Goal Seek will not solve this problem, as you have constraints in place so as we have two variable constraints in place we must use Solver.
In order for Solver to work, the cell you wish to calculate must tie back and be dependable on the cells you are going to change.
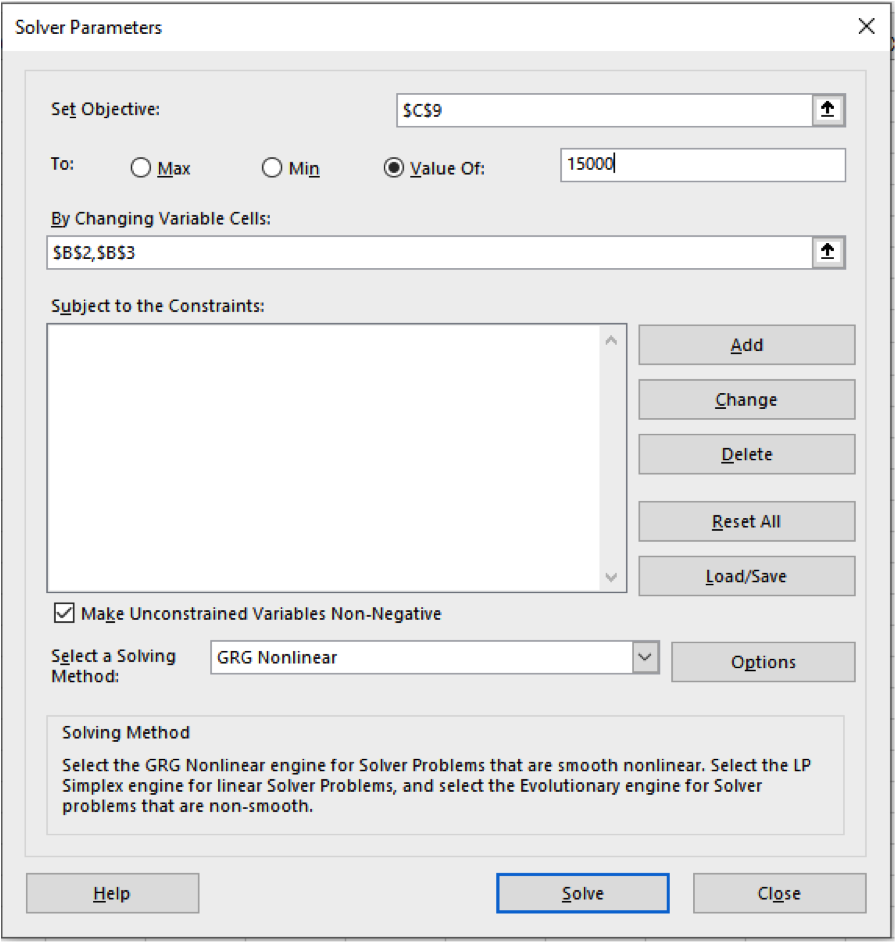
Once you have Solver turned on, you can access it via the Data Ribbon and it will open the Solver Parameters box.
Set Objective is the cell you wish to return the value for which in this case is we want revenues to be £15,000 so we set the objective cell C9. We then select the value of the set objective to be £15,000.
Variable cells are the cells that you wish to change so in our case this would be the units sold and the price by selecting cells B2 and B3 (remember each changing cell is separated by a comma).
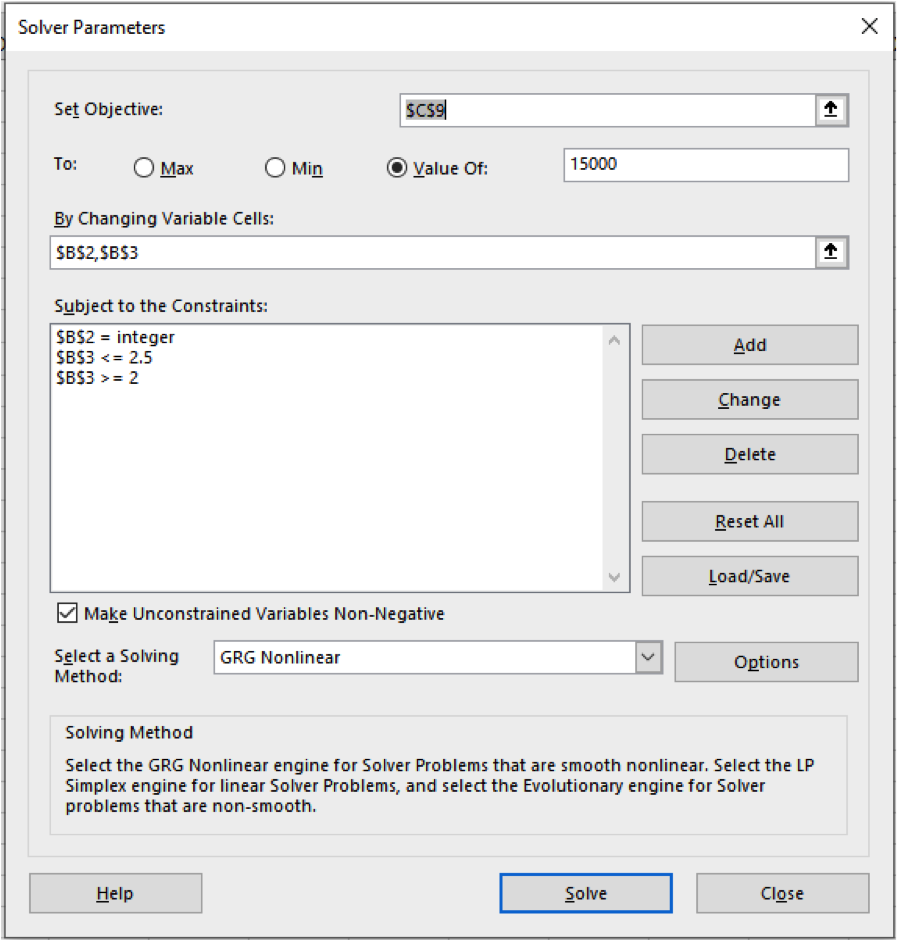
We can then add some constraints by pressing Add in the Solve Parameters box.
The first constraint is that the cost must be below £2.50. We add these values to the Subject to Constraints box, and hit Add.
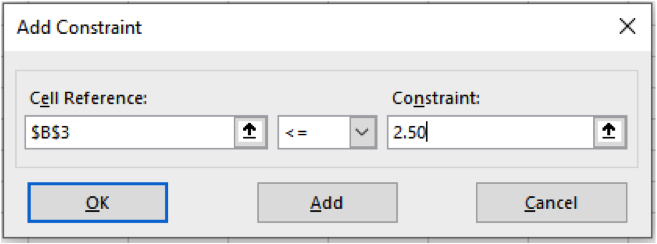
Then we must follow the same process to select B3 to be >= £2.00 and set cell B2 to be an integer to ensure partial units are not included.
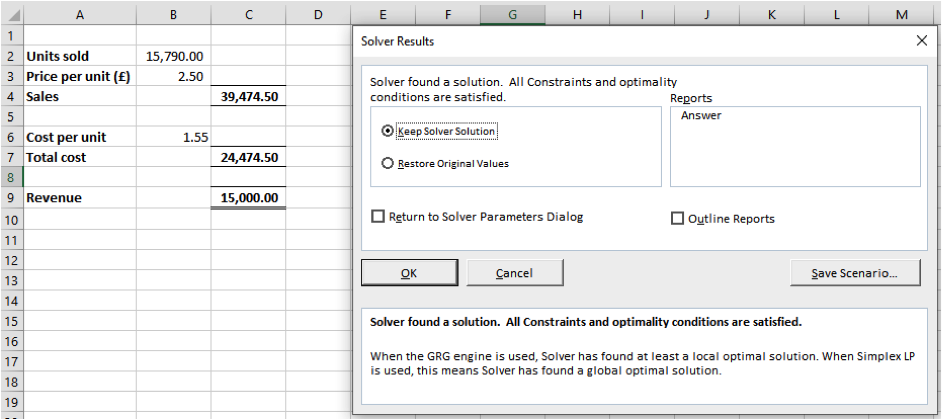
A solving method then needs to be selected. GRG Nonlinear is used to solve problems that are smooth or non-linear. LP Simplex solves linear problems and Evolutionary solves problems that are non-smooth. From here we can then press Solve and the results are produced:
As we move towards the ever-increasing need for data analysis, hopefully the above five analysis reports which can be produced using Excel demonstrates that it is not always necessary to invest in additional technology as very often it is already available at your disposal to help your company make more informed and quicker business decisions.
Astin Accounts Solutions is a fully qualified accountancy firm offering board-level accountancy experience, with particular focus on the following sectors: eGaming, Cryptocurrency, Technology, Health Care, Real Estate and Corporate Services. Contact us to find out how we can help your business thrive